Do Chemical Contaminants Cause Diabetes or Obesity?

"Today we're going to learn about odds ratios and relative risk."

“Today we’re going to learn about odds ratios and relative risk.”

Last year I watched part of a documentary called “Plastic Planet” on Current TV (Now Al Jazeera TV). It was alarming. Apparently chemicals are leaking out of plastics into the environment (or into foods contained by plastic), making us diabetic, fat, impairing our fertility, and God knows what else. The narrator talked like it was a sure thing. I had work to do at the hospital, so I didn’t see the whole thing. A couple chemicals I remember being mentioned are bisphenol A (BPA) and phthalates. I freaked my wife out when I mentioned it to her—she went and bought some storage containers for leftover food the next day. I always take my lunch to work in plastic containers and often cover microwaved food with Glad Press’n Seal plastic wrap.

A few days later I saw a report of sperm counts being half of what they were just half a century ago. (It’s debatable.) Environmental contaminants were mentioned as a potential cause.

So I spent a couple hours trying to figure out if chemical contamination really is causing obesity and type 2 diabetes. In the U.S., childhood obesity has tripled since 1980, to a current rate of 17%. Even preschool obesity (age 2-5) doubled from 5 to 10% over that span. In industrial societies, even our pets, lab animals (rodents and primates), and feral rats are getting fatter! The ongoing epidemics of obesity and type 2 diabetes, and our lack of progress in preventing and reversing them, testify that we may not have them figured out and should keep looking at root causes to see if we’re missing anything.

Straightaway, I’ll tell you it’s not easy looking into this issue. The experts are divided. The studies are often contradictory or inconsistent. One way to determine the cause of a condition or illness is to apply Bradford Hill criteria (see bottom of page for those). We could reach a conclusion faster if we did controlled exposure experiments on humans, but we don’t. We look at epidemiological studies and animal studies that don’t necessarily apply to humans.

Regarding type 1 diabetes and chemical contamination, we have very little data. I’ll not mention type 1 again.

What Does the Science Tell Us?

For this post I read a couple pertinent scientific reviews published in 2012, not restricting myself to plastics as a source of chemical contaminants.

The first was REVIEW OF THE SCIENCE LINKING CHEMICAL EXPOSURES TO THE HUMAN RISK OF OBESITY AND DIABETES from non-profit CHEM Trust, written by a couple M.D., Ph.D.s. I’ll share some quotes and my comments. My clarifying comments within a quote are in [brackets].

“It should be noted that diabetes itself has not been caused in animals exposed to these chemicals [a long list] in laboratory studies, but metabolic disruption closely related to the pathogenesis of Type 2 diabetes has been reported for many chemicals.”

“In 2002, Paula Baillie-Hamilton proposed a hypothesis linking exposure to chemicals with obesity, and this is now gaining credence. Exposure to low concentrations of some chemicals leads to weight gain in adult animals, while exposure to high concentrations causes weight loss.”

“The obesogen hypothesis essentially proposes that exposure to chemicals foreign to the body disrupts adipogenesis [fat tissue growth] and the homeostasis and metabolism of lipids (i.e., their normal regulation), ultimately resulting in obesity. Obesogens can be functionally defined as chemicals that alter homeostatic metabolic set-points, disrupt appetite controls, perturb lipid homeostasis to promote adipocyte hypertrophy [fat cells swelling with fat], stimulate adipogenic pathways that enhance adipocyte hyperplasia [increased numbers of fat cells] or otherwise alter adipocyte differentiation during development. These proposed pathways include inappropriate modulation of nuclear receptor function; therefore, the chemicals can be termed EDCs [endocrine disrupting chemicals].”

Don't assume mouse physiology is the same as human's

Don’t assume mouse physiology is the same as human’s

Literature like this talks about POPs: persistent organic pollutants, sometimes called organohalides. The POPs and other chemical contaminants that are currently suspicious for causing obesity and type 2 diabetes include arsenic, pesticides, phthalates, metals (e.g., cadmium, mercury, organotins), brominated flame retardants, DDE (dichloro-diphenyldichloroethylene), PCBs (polychlorinated biphenyls), trans-nonachlor, dioxins.

Another term you’ll see in this literature is EDCs: endocrine disrupting chemicals. These chemicals mess with hormonal pathways. EDCs that mimic estrogen are linked to obesity and related metabolic dysfunction. Some of the chemicals in the list above are EDCs.

The fear—and some evidence—is that contaminants, whether or not EDCs, are particularly harmful to embryos, fetuses, and infants. For instance, it’s pretty well established that mothers who smoked while pregnant predispose their offspring to obesity in adulthood. (Epigenetics, anyone?) Furthermore, at the right time in the life cycle, it may only take small amounts of contaminants to alter gene expression for the remainder of life. For instance, the number of fat cells we have is mostly determined some time in childhood (or earlier?). As we get fat, those cells simply swell with fat. When we lose weight, those cells shrink, but the total cell number is unchanged. What if contaminant exposure in childhood increases fat cell number irrevocably? Does that predispose to obesity later in life?

The authors note that chemical contaminants are more strongly linked to diabetes than obesity. They do a lot of hemming and hawing, using “maybe,” “might,” “could,” etc. They don’t have a lot of firm conclusions other than “Hey, people, we better wake up and look into this further, and based on the precautionary principle, we better cut back on environmental chemical contamination stat!” [Not a direct quote.] It’s clear they are very concerned about chemical contaminants as a public health issue.

Here’s the second article I read: Role of Environmental Chemicals in Diabetes and Obesity: A National Toxicology Program Workshop Review. About 50 experts were empaneled. Some quotes and my comments:

“Overall, the review of the existing literature identified linkages between several of the environmental exposures and type 2 diabetes. There was also support for the “developmental obesogen” hypothesis, which suggests that chemical exposures may increase the risk of obesity by altering the differentiation of adipocytes [maturation and development of fat cells] or the development of neural circuits that regulate feeding behavior. The effects may be most apparent when the developmental [early life] exposure is combined with consumption of a high-calorie, high-carbohydrate, or high-fat diet later in life.”

“The strongest conclusion from the workshop was that nicotine likely acts as a developmental obesogen in humans. This conclusion was based on the very consistent pattern of overweight/obesity observed in epidemiology studies of children of mothers who smoked during pregnancy (Figure 1) and was supported by findings from laboratory animals exposed to nicotine during prenatal [before birth] development.”

I found some data that don’t support that conclusion, however. Here’s a graph of U.S. smoking rates over the years since 1944. Note that the smoking rate has fallen by almost half since 1983, while obesity rates, including those of children, are going the opposite direction. If in utero cigarette smoke exposure were a major cause of U.S. childhood obesity, we’d be seeing less, not more, childhood obesity. I suppose we could still see a fall-off in adult obesity rates over the next 20 years, reflecting lower smoking rates.  But I doubt that will happen.

The CDC suggests a slight drop in childhood obesity in recent years (2010 data).

“The group concluded that there is evidence for a positive association of diabetes with certain organochlorine POPs [persistent organic pollutants]. Initial data mining indicated the strongest associations of diabetes with trans-nonachlor, DDT (dichloro-diphenyltrichloroethane)/DDE (dichloro-diphenyldichloroethylene)/DDD (dichloro-chlorophenylethane), and dioxins/dioxin-like chemicals, including polychlorinated biphenyl (PCBs). In no case was the body of data considered sufficient to establish causality [emphasis added].”

“Overall, this breakout group concluded that the existing data, primarily based on animal and in vitro studies [no live animals involved], are suggestive of an effect of BPA on glucose homeostasis, insulin release, cellular signaling in pancreatic β cells, and adipogenesis. The existing human data on BPA and diabetes (Lang et al. 2008; Melzer et al. 2010) available at the time of the workshop were considered too limited to draw meaningful conclusions. Similarly, data were insufficient to evaluate BPA as a potential risk factor for childhood obesity.”

“It was not possible to reach clear conclusions about BPA and obesity from the existing animal data. Although several studies report body weight gain after developmental exposure, the overall pattern across studies is inconsistent.”

“The pesticide breakout group concluded the epidemiological, animal, and mechanistic data support the biological plausibility that exposure to multiple classes of pesticides may affect risk factors for diabetes and obesity, although many significant data gaps remain.”

“Recently, the focus of investigations has shifted toward studies designed to understand the consequences of developmental exposure to lower doses of organophosphates [insecticides], and the long-term effects of these exposures on metabolic dysfunction, diabetes, and obesity later in life. [All or nearly all the studies cited here were rodent studies, not human.] The general findings are that early-life exposure to otherwise subtoxic levels of organophosphates results in pre-diabetes, abnormalities of lipid metabolism, and promotion of obesity in response to increased dietary fat.”

In case it’s not obvious, remember that “association is not the same as causation.” For example, in the Northern hemisphere, higher swimsuit purchases are associated with summer. Swimsuit sales and summer are linked (associated), but one doesn’t cause the other. Swimsuit purchases are caused by the desire to go swimming, and that’s linked to warm weather.

In at least one of these two review articles, I looked carefully at the odds ratios of various chemicals linked to adverse outcomes. One way this is done is too measure the blood or tissue levels of a contaminant in a population, then compare the adverse outcome rates in animals with the highest and lowest levels of contamination. For instance, if those with the highest contamination have twice the incidence of diabetes as the least contaminated, the odds ratio is 2. You could also call it the relative risk. Many of the potentially harmful chemicals we’re considering have a relative risk ratio of 1.5 to 3. Contrast those numbers with the relative risk of death from lung cancer in smokers versus nonsmokers: the relative risk is 10. Smokers are 10 times more likely to die of lung cancer. That’s a much stronger association and a main reason we decided smoking causes lung cancer. Odds ratios under two are not very strong evidence when considering causality; we’d like to have more pieces of the puzzle.

These guys flat-out said arsenic is not a cause of diabetes in the U.S.

Overall, the authors of the second article I read were clearly less alarmed than those of the first. Could the less-alarmed panelists have been paid off by the chemical industry to produce a less scary report, so as not to jeopardize their profits? I don’t have the resources to investigate that possibility. The workshop was organized (and paid for, I assume) by the U.S. government, but that’s no guarantee of pure motivation by any means.

You need a break. Enjoy.

You need a break. Enjoy.

My Conclusions

For sure, if I were a momma rat contemplating pregnancy, I’d avoid all those chemicals like the plague!

It’s premature to say that these chemical contaminants are significant causes of obesity and type 2 diabetes in humans. That’s certainly possible, however. We’ll have to depend on unbiased scientists to do more definitive research for answers, which certainly seems a worthwhile endeavor. Something tells me the chemical producers won’t be paying for it. Universities or governments will have to do it.

You should keep your eyes and ears open for new evidence.

There’s more evidence for chemical contaminants as a potential cause of type 2 diabetes than for obesity. Fetal and childhood exposure may be more harmful than later in life.

If I were 89-years-old, I wouldn’t worry about these chemicals causing obesity or diabetes. For those quite a bit younger, taking action to avoid these environmental contaminants is optional. As for me, I’m drinking less water out of plastic bottles and more tap water out of glass or metal containers. Yet I’m not sure which water has fewer contaminants.

Humans, particularly those anticipating pregnancy and child-rearing, might be well advised to minimize exposure to the aforementioned chemicals. For now, I’ll leave you to your own devices to figure out how to do that. Good luck.

Why not read the two review articles I did and form your own opinion?

Unless the chemical industry is involved in fraud, bribery, obfuscation, or other malfeasance, the Plastic Planet documentary gets ahead of the science. I’m less afraid of my plastic containers now.

Steve Parker, M.D.

Additional Resources:

Sarah Howard at Diabetes and the Environment (focus on type 1 but much on type 2 also).

Jenny Ruhl, who thinks chemical contaminants are a significant cause of type 2 diabetes (search her site).

From Wikipedia:

The Bradford Hill criteria, otherwise known as Hill’s criteria for causation, are a group of minimal conditions necessary to provide adequate evidence of a causal relationship between an incidence and a consequence, established by the English epidemiologist Sir Austin Bradford Hill (1897–1991) in 1965.

The list of the criteria is as follows:

  1. Strength: A small association does not mean that there is not a causal effect, though the larger the association, the more likely that it is causal.
  2. Consistency: Consistent findings observed by different persons in different places with different samples strengthens the likelihood of an effect.
  3. Specificity: Causation is likely if a very specific population at a specific site and disease with no other likely explanation. The more specific an association between a factor and an effect is, the bigger the probability of a causal relationship.
  4. Temporality: The effect has to occur after the cause (and if there is an expected delay between the cause and expected effect, then the effect must occur after that delay).
  5. Biological gradient: Greater exposure should generally lead to greater incidence of the effect. However, in some cases, the mere presence of the factor can trigger the effect. In other cases, an inverse proportion is observed: greater exposure leads to lower incidence.
  6. Plausibility: A plausible mechanism between cause and effect is helpful (but Hill noted that knowledge of the mechanism is limited by current knowledge).
  7. Coherence: Coherence between epidemiological and laboratory findings increases the likelihood of an effect. However, Hill noted that “… lack of such [laboratory] evidence cannot nullify the epidemiological effect on associations”.
  8. Experiment: “Occasionally it is possible to appeal to experimental evidence”.
  9. Analogy: The effect of similar factors may be considered.

Science-Based Medicine blog has more on Hill’s criteria.

Comments Off on Do Chemical Contaminants Cause Diabetes or Obesity?

Filed under Causes of Diabetes, Overweight and Obesity

Mediterranean Diet Once Again Linked to Lower Risk of Type 2 Diabetes

Conquer Diabetes and Prediabetes, Steve Parker MD

Olive oil and vinegar

And eating low glycemic load helps, too, according to an article at MedPageToday. The 22,000 Greek study participants were followed for 11 years. From the article:

The findings suggest that eliminating or strictly limiting high glycemic load foods such as those high in refined sugars and grains and following the largely plant-based Mediterranean diet, which emphasizes vegetables, fruits, nuts and legumes, can have a significant impact on diabetes risk, La Vecchia said.

“The impact of the diets was synergistic,” he told MedPage Today. “The message is that eating a largely Mediterranean diet that is also low in glycemic load is particularly favorable for preventing diabetes.”

Spanish researchers found the same thing a few years ago.

The Mediterranean diet is also healthy for those who already have type 2 diabetes.

The Low-Carb Mediterranean Diet may be the ideal way of eating for diabetics.

Steve Parker, M.D.

Comments Off on Mediterranean Diet Once Again Linked to Lower Risk of Type 2 Diabetes

Filed under Glycemic Index and Load, Health Benefits, Mediterranean Diet, Prevention of T2 Diabetes

Which Drugs Are Being Used For Type 2 Diabetes in the U.S.?

Better living through chemistry

Better living through chemistry?

Diabetes Care recently published results of a survey covering 1997 to 2012. The focus was on T2 diabetics age 35 or older:

“Between 1997 and 2012 biguanide [metformin] use increased, from 23% … to 53% … of treatment visits. Glitazone use grew from 6% in 1997 to 41% of all visits in 2005, but declined to 16% by 2012. Since 2005, DPP-4 inhibitor [e.g., Januvia] use increased steadily, representing 21% of treatment visits by 2012. GLP-1 agonists [e.g., Byetta] accounted for 4% of treatment visits in 2012. Visits where two or more drug compounds were used increased nearly 40% from 1997 to 2012. Between 2008 and 2012, drug expenditures increased 61%, driven primarily by use of insulin glargine [e.g., Lantus] and DPP-4 inhibitors.”

We have 12 classes of drugs for the treatment of T2 diabetes now. It’s not entirely clear which ones are the best. Since the long-term side effects of many drugs are unknown, if I had T2 diabetes I’d try to limit my need for drugs by restricting my carbohydrate consumption.

Steve Parker, M.D.

Comments Off on Which Drugs Are Being Used For Type 2 Diabetes in the U.S.?

Filed under Drugs for Diabetes

FDA Reversal: Rosiglitazone DOES NOT Pose Cardiovascular Risk

Rosiglitazone is a type 2 diabetes drug in the thiazolidinedione class. In 2011, the U.S. Food and Drug Administration determined that rosiglitzone posed a substantial risk for causing premature cardiovascular disease such as heart attacks. The agency greatly restricted prescribers, essentially killing the drug’s sales in the U.S. In November, the FDA took another look at the data and decided the risk was minimal or non-existent.

Dr. Steven Nissen of the Cleveland Clinic is on record as opposing the new change.

A lot of personal injury lawyers will be disappointed in the change unless they’ve already settled their cases out of court.

1 Comment

Filed under Drugs for Diabetes

Dr. Andreas Eenfeldt Posted Another Testimonial From a T2 Diabetic With a Dramatic Response to Low-Carb Eating

Click for details.

Comments Off on Dr. Andreas Eenfeldt Posted Another Testimonial From a T2 Diabetic With a Dramatic Response to Low-Carb Eating

Filed under Uncategorized

Your Response to Physical Training Depends on Your Genes

Steve Parker MD

Her response depends on genes, training program, nutrition, discipline, adequate sleep, adequate rest, etc.

This is disillusioning, but you need to know about it. Here’s an excerpt from an interview with author David Epstein in Outside online. Epstein wrote The Sports Gene: Inside the Science Of Extraordinary Athletic Performance:

Interviewer: That’s one of the most fascinating and unexpected parts of the book, where you discuss the Heritage study’s findings on trainability. Explain its implications.

Epstein: That’s the most famous exercise-genetics study ever done. It’s the collaboration of five colleges in the U.S. and Canada. They took sedentary, two-generation families, which didn’t have a training history, and put them through stationary-bike exercise plans that were totally controlled. Families had to go into the lab and exercise over five months. The goal was to see how people would improve, and they were split into four different university centers to do the training and every center saw the exact same pattern. About 15% of people improved their aerobic capacity very little or not at all. And 15% improved 50% or more doing identical training. Families tended to stick together in the improvement curve, so about half of any person’s improvement was determined by their parents. I remember the editorial that ran in the journal of applied physiology “some people’s alphabet soup—meaning their DNA—didn’t spell ‘runner.’” One person training the exact same as another person can have completely different outcomes.

Many folks don’t like to admit this, assuming it’s true. “Set your mind to it, work hard—10,000 hours—and you can do or be anything you want.” Have you ever been tortured by unrealistic expectations? The truth will set you free.

Read the rest.

Steve Parker, M.D.

Comments Off on Your Response to Physical Training Depends on Your Genes

Filed under Exercise

High Blood Sugar Raises Risk for Dementia, Even For Non-Diabetics

dementia, memory loss, Mediterranean diet, low-carb diet, glycemic index, dementia memory loss

“Let’s work on getting those blood sugars down, honey.”

On the heels of a report finding no association between Alzheimer’s disease and abnormal blood sugar metabolism, MedPageToday features an new study linking high blood sugars to future development of dementia. And diabetics with sugar levels higher than other diabetics were more prone to develop dementia.

Some of you have already noted that not all cases of dementia are Alzheimer’s dementia. But Alzheimer’s accounts for a solid majority of dementia cases, about eight in 10 cases.

Some quotes from MedPageToday:

During a median follow-up of 6.8 years, 524 participants [of the 2,000 total] developed dementia, consisting of 74 with diabetes and 450 without. Patients without diabetes and who developed dementia had significantly higher average glucose levels in the 5 years before diagnosis of dementia (P=0.01). The difference translated into a hazard ratio of 1.18 (95% CI 1.04-1.33).

…

Among the patients with diabetes, glucose levels averaged 190 mg/dL in those who developed dementia versus 160 mg/dL in those who did not. The difference represented a 40% increase in the hazard for dementia (HR 1.40, 95% CI 1.12-1.76).

—Steve Parker, M.D.

Reference: Crane PK et al. “Glucose Levels and Risk of Dementia” N Engl J Med 2013; 369: 540-548.

Reminder: Conquer Diabetes and Prediabetes is now available on Kindle.

Comments Off on High Blood Sugar Raises Risk for Dementia, Even For Non-Diabetics

Filed under Dementia, Diabetes Complications

Can You Manage Your Type 2 Diabetes Without Drugs?

David Mendosa says you can. I’m not quite that optimistic, but probably a majority can, if they have the knowledge, discipline, and willpower. Here are some snippets from David’s blog:

You can use drugs to bring your A1C level down to normal. That’s a good thing. But this strategy does have its costs, and those costs aren’t just money out of your pocket or your checkbook. The worst of those costs are the potential side effects of the drugs.

***

But some of us think we have a safer strategy of managing our diabetes without drugs. Back in 2007 I joined this group with the encouragement of a good friend of mine who is a Certified Diabetes Educator. Before that, I had 14 years of experience taking a wide range of diabetes drugs, including two different sulfonylureas (Diaßeta and Amyrl), Glucophage (metformin), and Byetta. For the past six years I haven’t taking any diabetes drugs, and yet I keep my diabetes in control with an A1C level usually about 5.4.

I had to make three big changes in my life when I went off the diabetes drugs, and they are hard at first. But now they are a routine part of my life, and I would never go back to my old ways. The changes that I had to make are those that almost everyone who has diabetes has to make. In order of importance, I had (1) to lose weight, (2) eat fewer carbohydrates, and (3) exercise more.

Read the whole enchilada. It’s brief.

Steve Parker, M.D.


4 Comments

Filed under Exercise, Fat in Diet

What Causes Type 2 Diabetes?

diabetic diet, low-carb Mediterranean Diet, low-carb, Conquer Diabetes and Prediabetes

Stop reading this sciencey post when you get bored

According to Roy Taylor, “type 2 diabetes is a potentially reversible metabolic state precipitated by the single cause of chronic excess intraorgan fat.” The organs accumulating fat are the liver and pancreas. He is certain “…that the disease process can be halted with restoration of normal carbohydrate and fat metabolism.” I read Taylor’s article published earlier this year in Diabetes Care.

[Do you remember that report in 2011 touting cure of T2 diabetes with a very low calorie diet? Taylor was the leader. The study involved only 11 patients, eating 600 calories a day for eight weeks.]

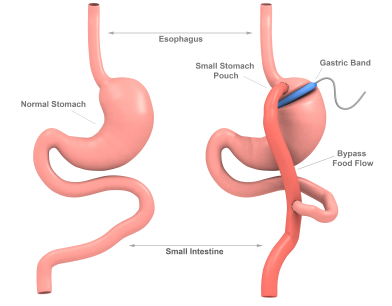
Dr. Taylor (M.D.) says that severe calorie restriction is similar to the effect of bariatric surgery in curing or controlling diabetes. Within a week of either intervention, liver fat content is greatly reduced, liver insulin sensitivity returns, and fasting blood sugar levels can return to normal. During the first eight weeks after intervention, pancreatic fat content falls, with associated steadily increasing rates of insulin secretion by the pancreas beta cells.

bariatric surgery, Steve Parker MD

Band Gastric Bypass Surgery (not the only type of gastric bypass): very successful at “curing” T2 diabetes if you survive the operation

Taylor’s ideas, by the way, dovetail with Roger Unger’s 2008 lipocentric theory of diabetes. Click for more ideas on the cause of T2 diabetes.

Here are some scattered points from Taylors article. He backs up most of them with references:

  • In T2 diabetes, improvement in fasting blood sugar reflects improved liver insulin sensitivity more than muscle insulin sensitivity.
  • The more fat accumulation in the liver, the less it is sensitive to insulin. If a T2 is treated with insulin, the insulin dose is positively linked to how much fat is in the liver.
  • In a T2 who starts insulin injections, liver fat stores tend to decrease. That’s because of suppression of the body’s own insulin delivery from the pancreas to the liver via the portal vein.
  • Whether obese or not, those with higher circulating insulin levels “…have markedly increased rates of hepatic de novo lipogenesis.” That means their livers are making fat. That fat (triglycerides or triacylglycerol) will be either burned in the liver for energy (oxidized), pushed into the blood stream for use elsewhere, or stored in the liver. Fatty acids are components of triglycerides. Excessive fatty acid intermediaries in liver cells—diglycerides and ceramide—are thought to interfere with insulin’s action, i.e., contribute to insulin resistance in the liver.
  • “Fasting plasma glucose concentration depends entirely on the fasting rate of hepatic [liver] glucose production and, hence, on its sensitivity to suppression by insulin.”
  • Physical activity, low-calorie diets, and thiazolidinediones reduce the pancreas’ insulin output and reduce liver fat levels.
  • Most T2 diabetics have above-average liver fat content. MRI scans are more accurate than ultrasound for finding it.
  • T2 diabetics have on average only half of the pancreas beta cell mass of non-diabetics. As the years pass, more beta cells are lost. Is the a way to preserve these insulin-producing cells, or to increase their numbers? “…it is conceivable that removal of adverse factors could result in restoration of normal beta cell number, even late in the disease.”
  • “Chronic exposure of [pancreatic] beta cells to triacylglycerol [triglycerides] or fatty acids…decreases beta cell capacity to respond to an acute increase in glucose levels.” In test tubes, fatty acids inhibit formation of new beta cells, an effect enhanced by increased glucose concentration.
  • There’s a fair amount of overlap in pancreas fat content comparing T2 diabetics and non-diabetics. It may be that people with T2 diabetes are somehow more susceptible to adverse effects of the fat via genetic and epigenetic factors.
  • “If a person has type 2 diabetes, there is more fat in the liver and pancreas than he or she an cope with.”
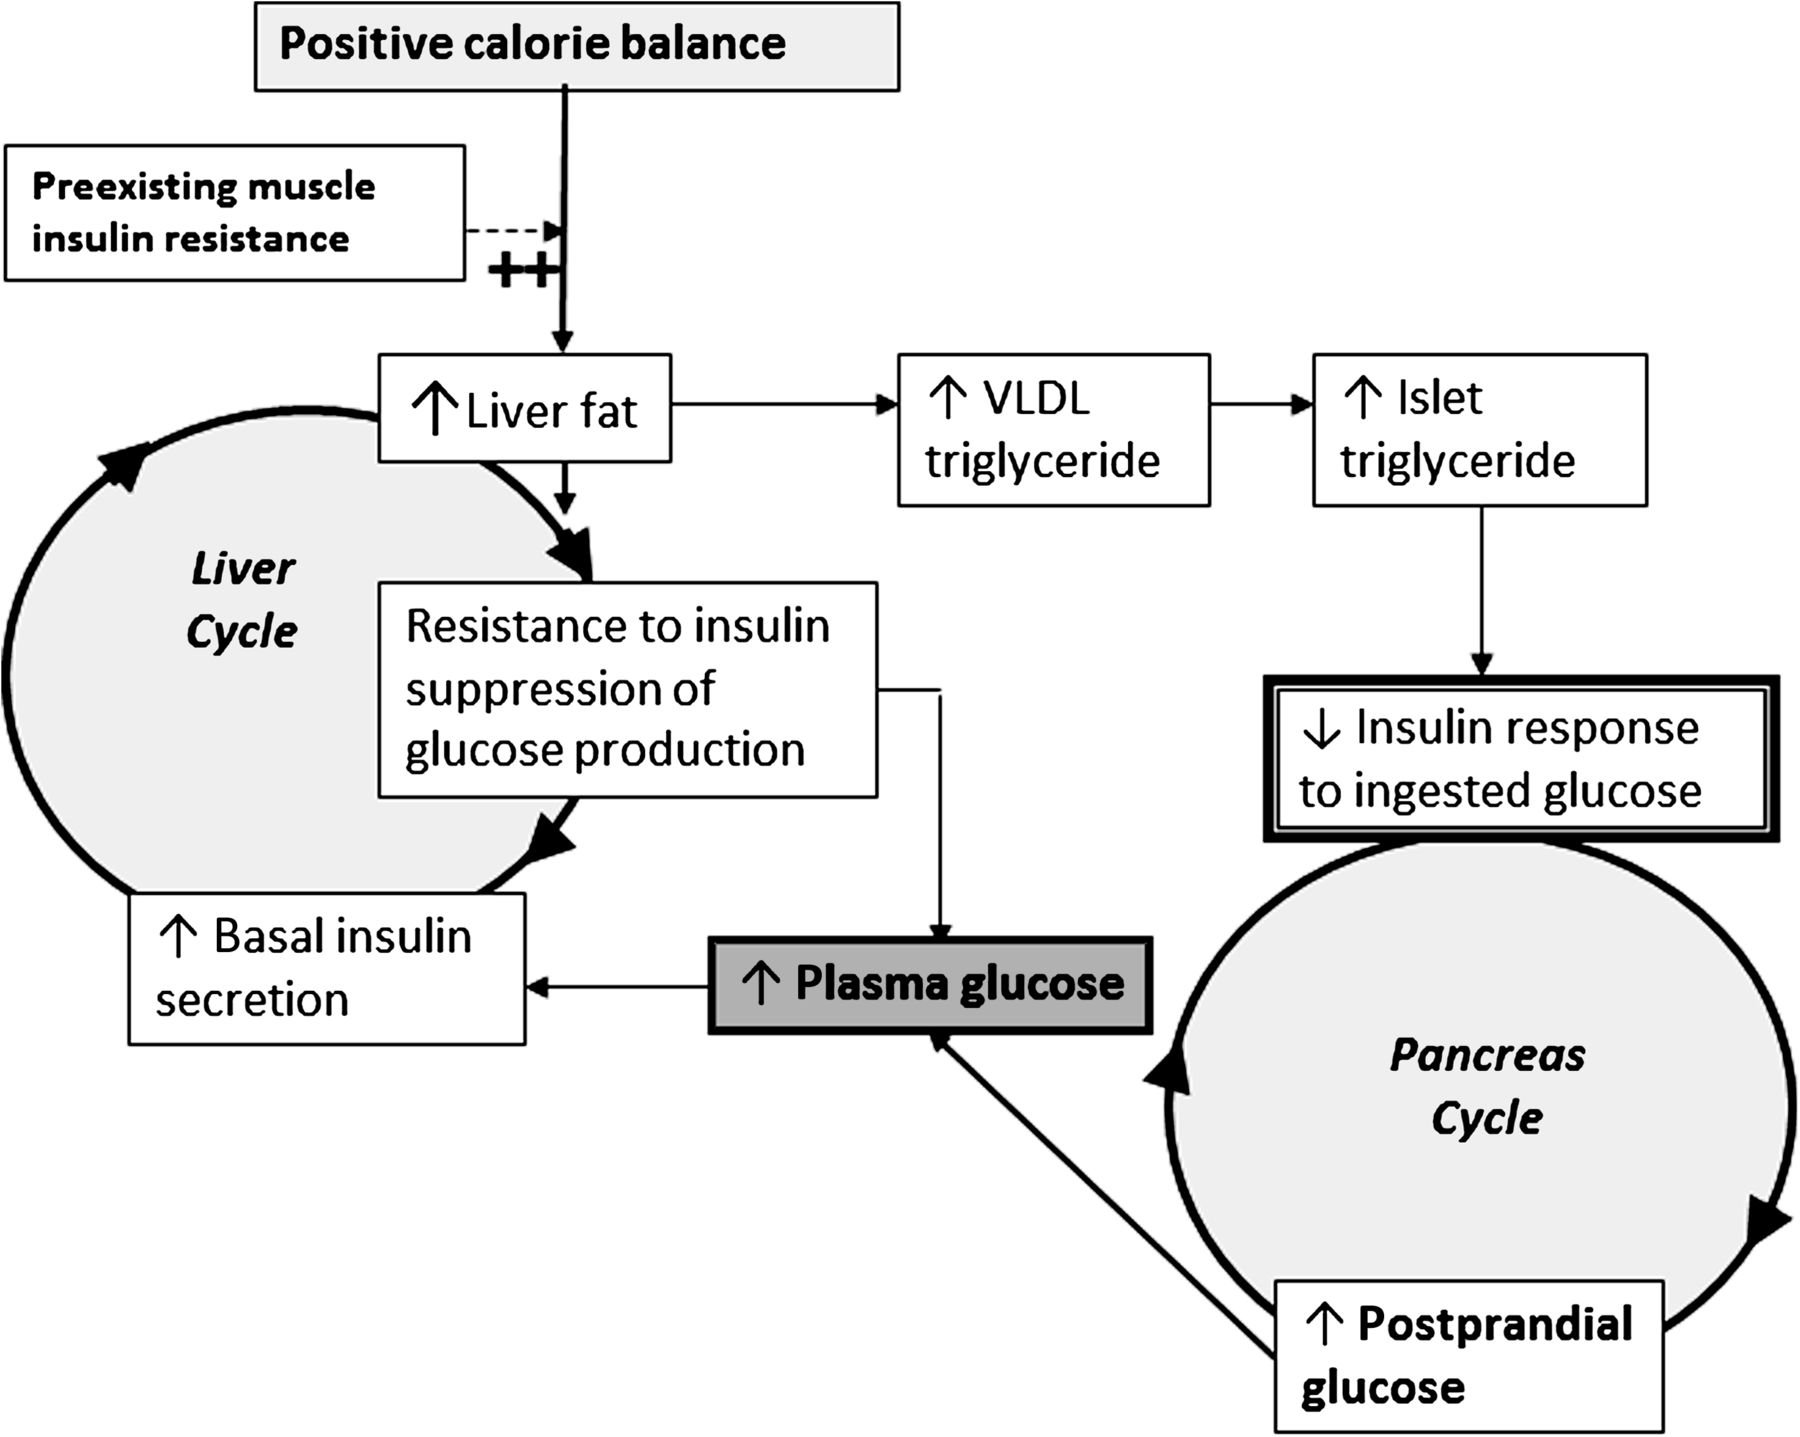
  • Here’s Dr. Taylor’s Twin Cycle Hypothesis of Etiology of Type 2 Diabetes: “The accumulation of fat in liver and secondarily in the pancreas will lead to self-reinforcing cycles that interact to bring about type 2 diabetes. Fatty liver leads to impaired fasting glucose metabolism and increases export of VLDL triacylglcerol [triglycerides], which increases fat delivery to all tissues, including the [pancreas] islets. The liver and pancreas cycles drive onward after diagnosis with steadily decreasing beta cell function. However, of note, observations of the reversal of type 2 diabetes confirm that if the primary influence of positive calorie balance is removed, the the processes are reversible.”
diabetic diet, etiology of type 2 diabetes, Roy Taylor, type 2 diabetes reversal

Figure 6 from the article: Dr. Taylor’s Twin Cycle Hypothesis of Etiology of Type 2 Diabetes

  • The caption with Figure 6 states: “During long-term intake of more calories than are expended each day, any excess carbohydrate must undergo de novo lipogenesis [creation of fat], which particularly promotes fat accumulation in the liver.”
  • “The extent of weight gloss required to reverse type 2 diabetes is much greater than conventionally advised.” We’re looking at around 15 kg (33 lb) or 20% of body weight, assuming the patient is obese to start.  “The initial major loss of body weight demands a substantial reduction in energy intake. After weight loss, steady weight is most effectively achieved by a combination of dietary restriction and physical activity.”

Dr. Taylor doesn’t specify how much calorie restriction he recommends, but reading between the lines, I think he likes his 600 cals/day for eight weeks program. That will have a have a high drop-out rate. I suspect a variety of existing ketogenic diets may be just as successful and more realistic, even if it takes more than eight weeks. I wonder how many of the 11 “cures” from the 2011 study have persisted.

Steve Parker, M.D.

Reference: Taylor, Roy. Type 2 diabetes: Etiology and reversibility. Diabetes Care, April 2013, vol. 36, no. 4, pp:1047-1055.

Update December 16, 2013:

Some wild and crazy guys tried this method at home. Click for results.

h/t commenter PhilT.

7 Comments

Filed under Causes of Diabetes

What’s the Best Diet for Type 2 Diabetics?

DietDoctor has some ideas based on a recent scientific study:

A new exciting Swedish study provides us with strong clues on how a person with diabetes should eat (and how to eat to maximize fat burning). It’s the first study to examine in detail how various blood markers change throughout the day depending on what a diabetic person eats.

The study examined the effects of three different diets in 19 subjects with diabetes type 2. They consumed breakfast and lunch under supervision in a diabetes ward. The caloric intake in the three diets examined was the same, but the diets differed in the following manner:

  1. A conventional low-fat diet (45-56% carbs)
  2. A Mediterranean diet with coffee only for breakfast (= similar to 16:8 intermittent fasting) and a big lunch (32-35% carbs)
  3. A moderate low-carbohydrate diet (16-24% carbs)

All participants tested all three diets, one diet each day in randomized order.

Click through for results. Hint: Carbohydrate restriction works.

2 Comments

Filed under Book Reviews