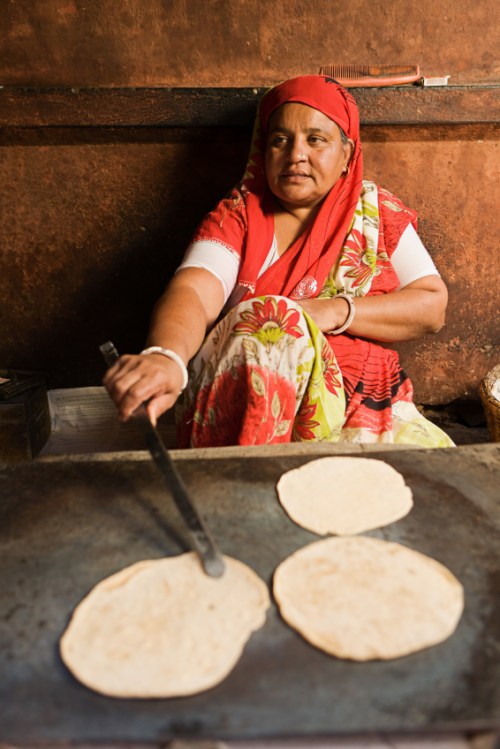
Indian woman cooking chapati
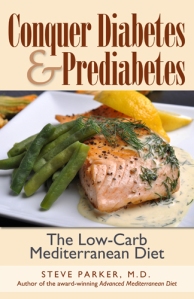
Here’s my review of The South Asian Health Solution: A culturally tailored guide to lose fat, increase energy, avoid disease by Ronesh Sinha, published in 2014.
♦ ♦ ♦
Dr. Sinha practices internal medicine in northern California (Silicon Valley) and has a large dose of South Asians in his clinic. “South Asia” usually encompasses India, Pakistan, Nepal, Bangladesh, Bhutan, Sri Lanka and Maldives. It is home to one fifth of the world’s population. This book pertains mostly to Indians, which is Dr. Sinha’s ethnicity. I live in the Pheonix, AZ, area and we have a fair number of Indian engineers and physicians.
WHY DO SOUTH ASIANS NEED THEIR OWN SPECIAL HEALTH GUIDE?
Because Dr. Sinha says they have unique genetic and cultural issues that predispose them to type 2 diabetes, abdominal obesity, coronary artery disease, high blood pressure, and adverse cholesterol numbers. For example, compared to natives who stay in their home countries, South Asian immigrants to the West have 3–4 times higher prevalence of diabetes, he says. Dr Sinha has a program that he’s convinced will prevent or forestall these medical problems in South Asians.
Dr. Sinha says South Asians eat too many carbohydrates and are too sedentary. Especially those who have moved to the West (e.g., US, UK, Europe, Canada). He notes that the core of the typical South Asian diet is flat breads, lentils, rice, fried crispy snacks (with heart-poisoning trans fats), culminating in 150–200 daily grams of carbohydrate more than he sees in other ethnics in California. Western fast foods, sodas, and sweets compound the problem.
He says “most South Asians are skinny-fat,” meaning skinny legs and arms but with a fat belly from visceral fat. This is also called sarcopenic obesity. The usual “healthy” body mass index (BMI) numbers don’t apply to Asians. The World Health Organisation classifies Asians as underweight if BMI is 18.4 or less, healthy at BMI of 18.5 to 13, overweight at BMI 23.1 to 25, and obese if BMi is over 25. These numbers are lower than those used for non-Asian populations.
Another issue in his South Asian patient population is vitamin D deficiency related to their dark skin (hence, less vitamin D production) and too much time indoors. He says vitamin D deficiency promotes inflammation and insulin resistance. More on this below.
Some South Asians have a K121Q gene mutation that causes insulin resistance, which in turn can cause disease. And whether it’s genetic or not (but I think it is), he says South Asians tend to have higher Lp(a) [aka lipoprotein(a)], which causes early and aggressive coronary artery disease. They also tend to have small dense LDL, leading to a lower-than-expected total cholesterol level which may be deceptively low.
Sinha notes a strong vegetarian preference in Indians but spends almost no time discussing it. From the book, I can’t tell if Indian vegetarians are lacto-ovo-vegetarians, pescetarians, or vegans. The author is not a vegetarian.

Gadi Sagar temple on Gadisar Lake, Jaisalmer, Rajasthan, India
SINHA’S GRAND UNIFICATION THEORY OF DISEASE CAUSATION
So, South Asians, at least in the West, have a high-carb diet, are too sedentary, and have genetic tendencies to heart disease and diabetes. How do these factors cause disease? It’s all tied together with insulin resistance. Insulin is the main hormone that keeps our blood sugar from rising too high after we digest a meal. Insulin drives blood sugar into our body cells to be used as energy or stored as fat or glycogen. If our tissues have insulin resistance, blood sugar levels rise. As a compensatory effort, our pancreas excretes more insulin in to the blood stream than would normally be the case. Whether or not that eventually lowers blood sugar levels, the higher insulin levels themselves can cause toxicity. For example, higher insulin levels raise blood pressure, which damages the cells lining the insides of our arteries, leading to chronic inflammation and atherosclerosis (hardening of the arteries). Some of the arterial damage is mediated through small dense LDL cholesterols (aka type B LDL), which is promoted by high insulin levels (hyperinsulinemia). Insulin resistance also results in a defective and overactive immune system, which further promotes chronic inflammation. This inflammation is “…the root cause of almost every imaginable chronic disease…from heart attacks and strokes to Alzheimers Disease.”
Anyway, this is Dr. Sinha’s hypothesis, and there is some scientific evidence to support it. Sinha says that the concept of insulin resistance “weaves together virtually every chronic ailment currently afflicting South Asians.” That may be a bit hyperbolic: He carves out no exceptions for arthritis, asthma, eczema, migraines, glaucoma, macular degeneration, hearing loss, erectile dysfunction, hepatitis C, prostate enlargement, toenail fungus, or male-pattern baldness.
Dr. Sinha’s Grand Unification Theory of Disease Causation has some support among physicians and scientists, but is by no means universally accepted among them. As for myself, I think he’s over-simplifying (for his readership’s sake?) and getting a bit ahead of the science.
Most clinicians aren’t testing directly for insulin resistance. What are the indirect clues? Belly fat, low HDL cholesterol, high trigylcerides, high blood pressure, prediabetes, and type 2 diabetes. These are components of the metabolic syndrome. Not everybody with one or more of these factors has insulin resistance but many do.
WHAT’S HIS PROGRAM?
If Sinha is correct, the South Asian Health Solution is a “low-insulin lifestyle” achieved through carbohydrate-reduced eating, exercise, and avoidance or resolution of belly fat. These help improve all components of the aforementioned metabolic syndrome. The backbone of the plan is carbohydrate restriction. For low-carb eating, avoid wheat bread and Indian flat breads (e.g., chapatis, naans, parathas, puris, phulkas), aloo (primarily potatoes and starchy vegetables), rice and other grains, beans, and sugar. Keep track of your net carbohydrates (he likes FitnessPal.com, which includes South Asian foods).
If you need to burn off body fat, limit carbs to 50–100 grams/day (digestible or net carbs, I assume). Aim for 100–150 grams/day to maintain health and weight loss.
You might be able to add “safe starches” later: white rice, potatoes. To replace your Indian flat breads, learn how to make them with substitutes for wheat flour: coconut flour or almond flour (no skins) or almond meal (skin included). Recipe on page 347. Rice alternatives are cauliflower “rice,” shredded cabbage, broccoli slaw, chopped broccoli, and chopped carrots.
He likes ghee, extra virgin olive oil, coconut oil, and butter. Avoid high omega-6 fatty acid consumption, as in vegetable oils. Of course, avoid trans fats. Good fats are saturated, monousaturated, and omega-3s.
He provides a few low-carb recipes, surprisingly without specific carb counts: chapatis, microwave bread, cauliflower pizza, coconut cauliflower rice, shredded cabbage sabji, gajar halwa (carrot pudding), and coconut ladoo.
Dr. Sinha doesn’t provide a comprehensive meal plan. He trusts his California South Asians to figure out how and what to eat. They’re smarter than average (he never says that, but that’s been my experience with South Asians in my world).
Dr. Sinha is also a huge proponent of exercise. He’ll tell you about squats, lunges, planks, burpees, yoga, and Tabata intervals. He agrees with me and Franziska Spritzler that “physical activity is the most effective fountain of youth available.”

Taking a rest from the fountain of youth
I skipped some of the chapters due to lack of time and interest: women’s issues (e.g., pregnancy, polycystic ovary syndrome, post-partum depression, osteoporosis), childhood, fatigue and stress management, and anti-aging.
MISCELLANEOUS TIDBITS
- He likes high-sensitivity CRP testing.
- His metabolic goals for South Asians are: 1) keep waist circumference under 35 inches (90 cm) in men, under 31 inches (80 cm) in women, 2) keep triglycerides under 100 mg/dl (1.13 mmol/l), 3) keep HDL cholesterol over 40 mg/dl (1.03 mmol/l) for men, and above 50 mg/dl (1.29 mmol/l) for women, 4) keep systolic blood pressure 120 or less, and diastolic pressure 80 or less, 5) keep fasting blood sugar under 100 mg/dl (5.6 mmol/l) and hemoglobin A1c under 5.7%, and 6) keep hs-CRP under 1.0 mg/dl.
- He says HDL cholesterol helps reduce insulin resistance via apoprotein A-1 (apo A-1), which increases glucose uptake by cells.
- He likes to follow the triglyceride/HDL ratio. If under 3, it means low risk of insulin resistance being present.
- He likes to follow total cholesterol/HDL cholesterol ratio: ideal is under 3.5.
- Statins are way over-used.
- Ignore total cholesterol level by itself.
- Stress control and sleep are important.
- The author had some metabolic syndrome components: high triglycerides, low HDL cholesterol, and type B LDL (small, dense particles).
- He dislikes the usual-recommended low-fat, low-cholesterol diet.
- 4 tbsp (60 ml) of extra virgin olive oil daily seems to lower blood pressure.
- Magnesium supplementation may lower blood pressure.
- The liver stores about 100 grams of glycogen and muscles store 300–500 grams.
- Vanaspati is a “cheap ghee substitute” made from vegetable oil and widely used in Indian restaurants and many Indian processed foods. Avoid it since it’s a source of trans fats.
- Aloo sabji is a potato dish.
- Traditional Indian herbs/spices include turmeric, cardamon, ginger, and cilantro.
- Find an Indian medication guide at http://www.medguideindia.com/show_brand.php.
- Coconut milk is a traditional fat in India.
- Curry, curry, curry.
- http://www.pamforg/southasian.
- http://southasiahealthsolutions.org.
- Non-alcoholic steatohepatitis (NASH) is quite common in South Asians, seemingly linked to visceral (abdominal) obesity and insulin resistance related to carbohydrates.
- The book has no specific focus on diabetes.
THUMBS UP OR DOWN?
Overall, I like many of Dr. Sinha’s ideas. They seem to be supported by his experience with his own patients. I trust him. I bet many South Asians and non-Asians eating the Standard American Diet would see improved health by following his low-carb, physically active program.
Steve Parker, M.D.